Earlier this year, the world (or maybe rather a few tech-savvy geeks like me) celebrated the 50th birthday of Moore’s Law.
In 1965, Intel co-founder Gordon Moore predicted that transistor density (and thus the performance) of microprocessors would double each 2 years. Take for example today’s iPhone 6, which is 3.5 times faster than the iPhone 1 while its price is 30% less than the first generation 7 years ago. Moore’s Law has been used as a stable basis for forecasting technology evolution in the ICT industry for the past 5 decades.
Reading a few articles about this special anniversary reminded me of a conference presentation I gave (also) many years ago, in which I explored the thin line between “nice to have” and “need to have” technology.
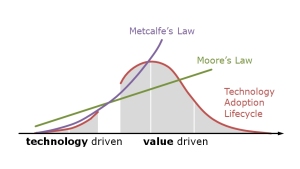
Starting with a picture of Moore’s Law, and with the help of two other famous industry laws, a bit of visual thinking, a healthy dose of abstraction and some creative chartsmithing, I developed the following storyline…
Note that, although “doubling each 2 years” suggests a parabola-shaped curve, Moore’s growth function is almost always represented a straight line ― complemented by an exponential scale on the Y-axis.
Several years after Gordon Moore’s famous observation, another ICT pioneer, 3Com co-founder Bob Metcalfe, stated that the value of a network grows as the square of the number of network nodes (or devices, or applications, or users, …) while the costs follow a more or less linear function. Take for example a wireless network: if you have only 2 subscribers with a mobile phone, they’re only able to make calls to each other. If you have millions of subscribers however…
Metcalfe’s Law is about network growth, customer acquisition, and value creation, rather than about technology evolution. The combination of Moore’s and Metcalfe’s laws explains the rise of information technology and the growth of the Internet as we know it today.
As the next step in my presentation flow, I introduced my audience to the technology adoption lifecycle, and more specifically to the “chasm theory” that was developed by another Mr Moore. In his book “Crossing the Chasm: Marketing and Selling High-Tech Products to Mainstream Customers,” management consultant Geoffrey A. Moore talks about the gap between the take up of new technology by early enthusiasts and the mainstream market.
And finally, in an unprecedented apotheosis, by combining the three preceding charts and by ― I have to admit ― visually cheating with axes, scales, and representations I came to the observation that the chasm is actually the point where the transition from a technology driven business to a value driven business needs to take place ― and if this doesn’t happen, that any new product or technology introduction is doomed to fail.
That’s a nice conclusion, which ― just like Moore’s Law ― still holds today, isn’t it?
You may view my original presentation on SlideShare. Please note that the deck dates from 2002, and that the market, my company, and the technology and product related content obviously have evolved since then.
Note: this post was republished by the World Economic Forum on April 21, 2015.


Pingback: Sometimes graphs are not more than pretty lines | B2B STORYTELLING
I wonder, do you think that this holds true for something like the Green Building movement, which has seen rapid public uptake over the last 10 years, but has very recently been saddled with a severe drop in green building certification registrations, and newly emerging empirical studies showing huge disparities between predicted green building outcomes and actual performance?
Pingback: Five stories of art | b2b storytelling
Pingback: Things in the mirror may be closer than they appear | Business storytelling
Pingback: The mysterious Mr Fubini | Business storytelling